QuestionSemiconductors / resistivity
Which one of the following schematic graphs correctly represents qualitatively the variation of resistivity ρ with respect to temperature T for a semiconductor?
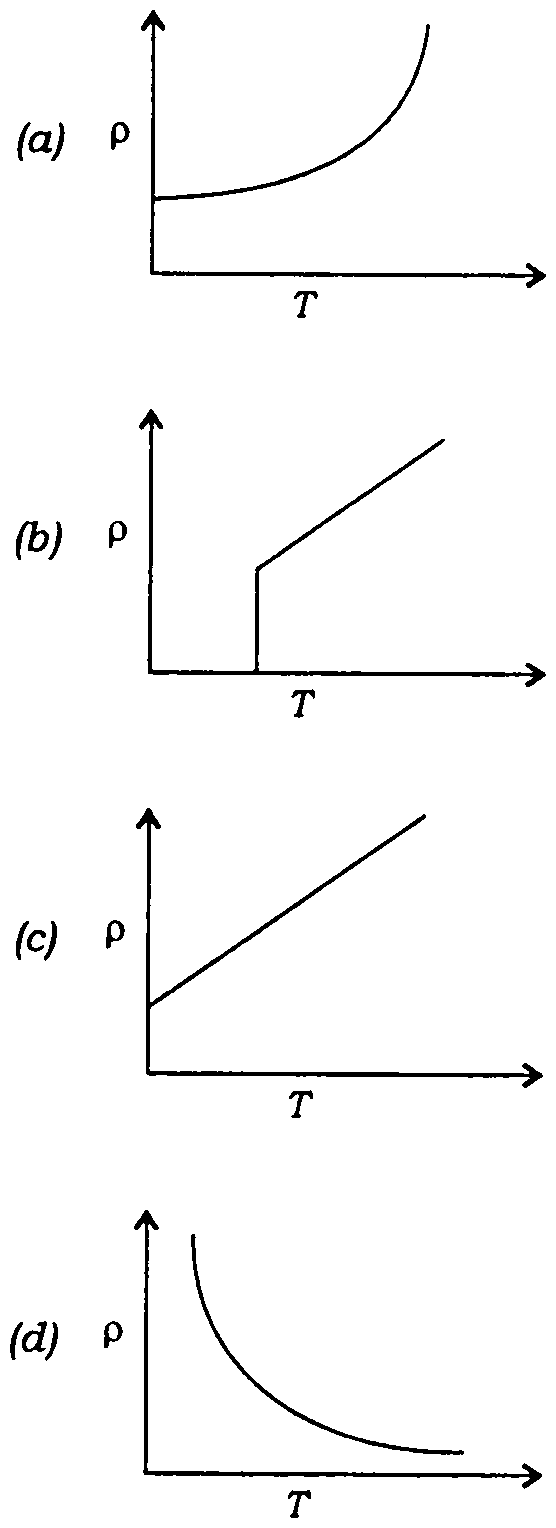
- (a) ρ rises slowly from a non-zero value, then steeply (curving upward) with T
- (b) ρ is zero up to a certain T, then jumps and rises linearly
- (c) ρ rises linearly with T from a non-zero intercept
- (d) ρ falls steeply and then flattens as T increases
Part of VKC Basic
Read the answer and its explanation with VKC Basic
VKC Basic (₹999 for 6 months) opens every solved answer, the notes, the handbook and the daily answer archive. Every Mains test series includes it.