QuestionElectrochemistry / Λ_m vs √c
The following graph shows the variation of molar conductance with the concentration of a/an
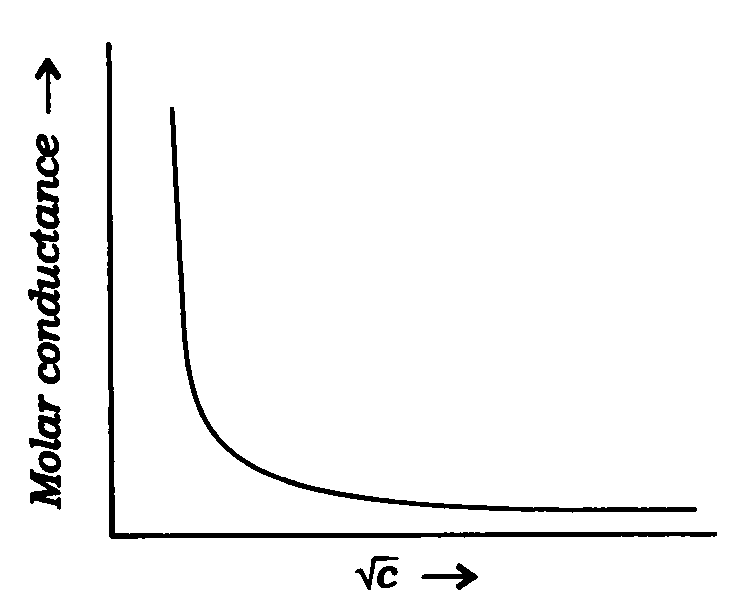
- (a) strong acid
- (b) weak acid
- (c) buffer
- (d) ethanol
Part of VKC Basic
Read the answer and its explanation with VKC Basic
VKC Basic (₹999 for 6 months) opens every solved answer, the notes, the handbook and the daily answer archive. Every Mains test series includes it.