QuestionThermodynamics / Gibbs energy and pressure
Which one of the following graphs correctly represents the variation of Gibbs energy with pressure ?
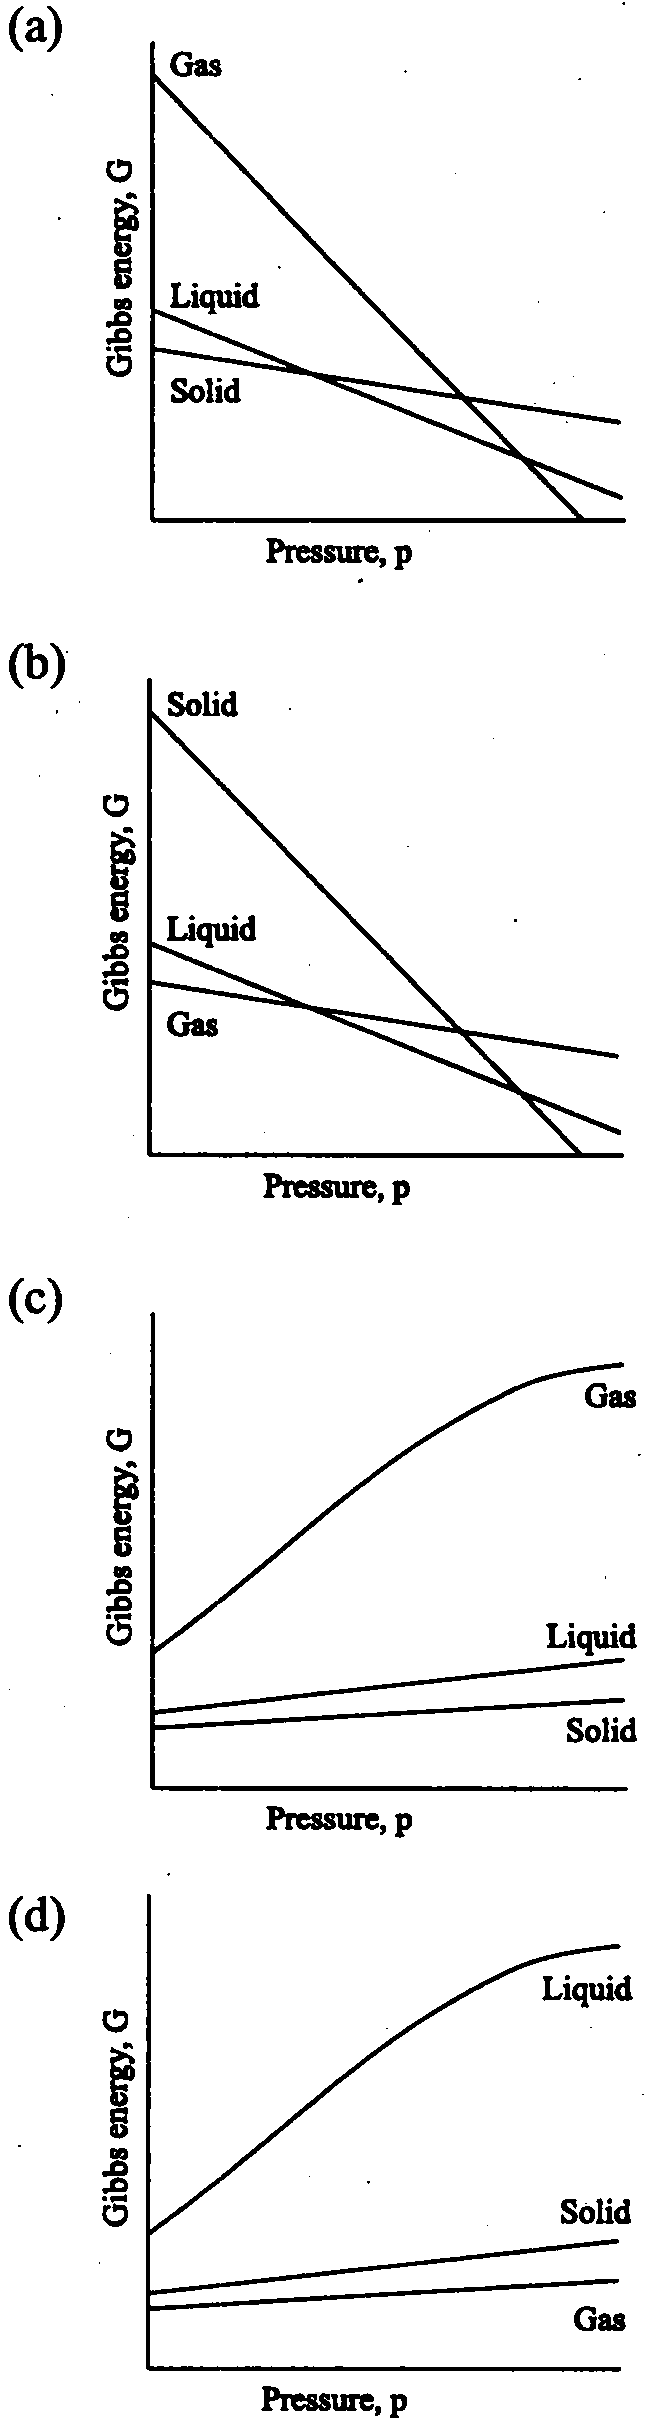
- (a) G of gas, liquid and solid all decrease linearly with pressure; gas line steepest (gas highest at low p)
- (b) G of solid, liquid and gas all decrease linearly with pressure; solid line steepest (solid highest at low p)
- (c) G of gas rises steeply and curves (levels off) with pressure; G of liquid and solid rise gently and almost linearly, liquid above solid
- (d) G of liquid rises steeply and curves with pressure; G of solid and gas rise gently and almost linearly, solid above gas
Part of VKC Basic
Read the answer and its explanation with VKC Basic
VKC Basic (₹999 for 6 months) opens every solved answer, the notes, the handbook and the daily answer archive. Every Mains test series includes it.